Full Documentation
Full documentation of NRV is available at https://nrv.readthedocs.io/.
Note : the documentation will in a near future move to https://www.docs.nrv-framework.org.
A quick example
NRV is based on a very basic idea: it should be easy to describe an electrophysiological setup, especially using object-oriented syntax. Here is a basic script, that define two axons (one unmyelinated and one myelinated), place an intra-cellular clamp with a current-stimulus. The simulation then computes the response from the fiber:
import nrv
import matplotlib.pyplot as plt
if __name__ == '__main__':
# axon def
y = 0 # axon y position, in [um]
z = 0 # axon z position, in [um]
d = 6 # axon diameter, in [um]
L = 5000 # axon length, along x axis, in [um]
axon1 = nrv.myelinated(y,z,d,L,rec='all')
t_start = 0.1
duration = 0.5
amplitude = 0.35
amplitude = 0.195
axon2 = nrv.unmyelinated(y,z,d,L,dt=0.001,Nrec=2000)
axon1.insert_I_Clamp(0, t_start, duration, amplitude)
amplitude = 10
axon2.insert_I_Clamp(0, t_start, duration, amplitude)
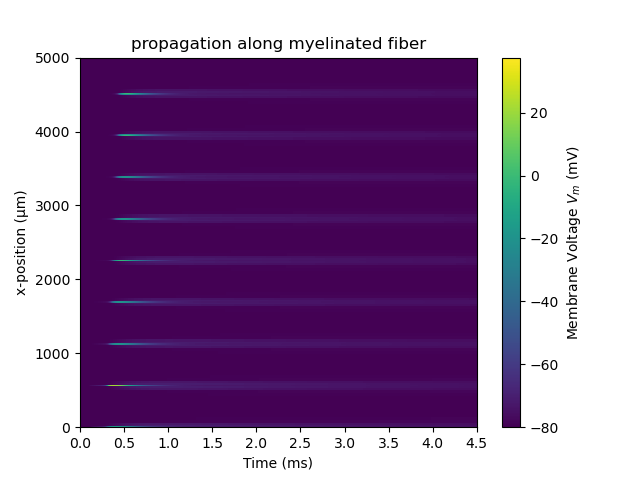
results = axon1.simulate(t_sim=4.5)
del axon1
fig, ax = plt.subplots(1)
cbar = results.colormap_plot(ax, "V_mem")
ax.set_xlabel('Time (ms)')
ax.set_ylabel('x-position (µm)')
ax.set_title('propagation along myelinated fiber')
cbar.set_label(r'Membrane Voltage $V_m$ (mV)')
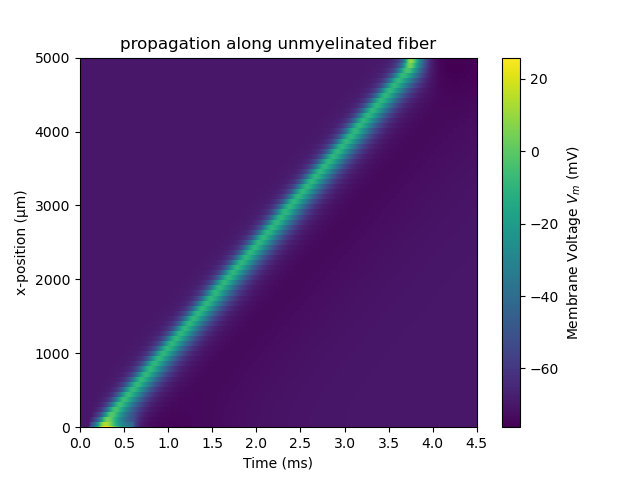
results = axon2.simulate(t_sim=4.5)
#nrv.rasterize(results,'V_mem')
del axon2
fig, ax = plt.subplots(1)
cbar = results.colormap_plot(ax, "V_mem")
ax.set_xlabel('Time (ms)')
ax.set_ylabel('x-position (µm)')
ax.set_title('propagation along unmyelinated fiber')
cbar.set_label(r'Membrane Voltage $V_m$ (mV)')
plt.show()
which should generate the following figures:
Online Demo
If you want to test NRV by your own, you can connect to myBinder throught this link, and will be able to explore few more examples. If you want to explore these examples off-line you can get them on github, and you can also have a look at our tutorials and example gallery directly in the documentation.